Spectral Indices
Spectral indices combine one or more raster bands into a derived raster. UavPy exposes built-in helpers for common indices and a safe expression parser for custom band math.
Index expressions use one-based band references. Check mosaic.band_info before choosing nir, red, red_edge, green, or blue band numbers.
Built-In Indices
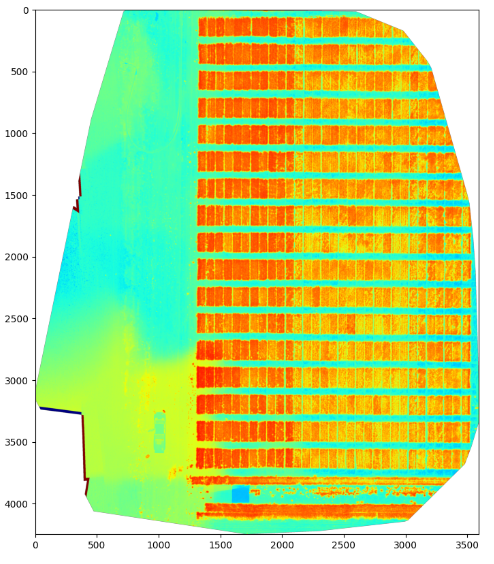
NDVI:
1 2 3 4 5 | |
WDVI:
1 2 3 | |
Other built-in constructors include gndvi, ndre, ndwi, ndmi, savi, osavi, msavi2, evi, evi2, dvi, rvi, ci_green, ci_red_edge, mtci, and sipi.
Custom Expressions
Expressions reference bands with one-based names: B1, B2, B3, and so on.
1 2 3 | |
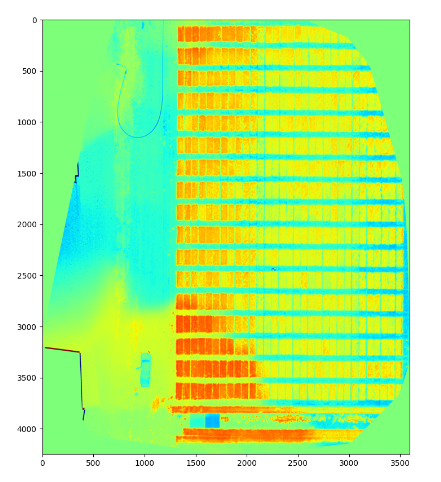
OSAVI-style expression:
1 2 3 | |
Supported Expression Syntax
The parser supports:
- Band references:
B1,B2,B10 - Numeric constants:
1,0.16,.5 - Operators:
+,-,*,/,% - Exponentiation:
^or** - Unary signs:
-B1,+B2 - Functions:
sin,cos,ln,sqrt,min,max,mean,std,var,sum,abs
Examples:
1 2 3 4 | |
Safe evaluation
Expressions are parsed with Python's AST module, but they are not evaluated with eval. UavPy validates every syntax node and only executes the supported arithmetic operations and functions listed above.
Band Index Rules
Band references are one-based and must exist in the raster array.
1 2 | |
If an expression references a band outside the raster's band count, UavPy raises a parser error.
Summarize And Save Results
The output of a spectral index is a single-band Orthomosaic, so it can be plotted, summarized through the wrapped DataArray, or saved as a GeoTIFF.
1 2 3 4 | |
Display Index Tiles
Save the index to a GeoTIFF and use the mapwidgets Python tile backend for colormaps and explicit value ranges.
1 2 3 4 5 6 7 8 9 10 11 12 13 14 15 16 17 18 19 20 21 22 23 24 25 26 | |